Leads & analytics
Every submission is kept in PopFlare, and every impression, click and conversion is aggregated live.
The leads inbox
Leads in the sidebar lists every submission on the site: email, campaign, the other submitted fields (hidden ones included), the page where the visitor converted, the outcome of each integration and the date. Each campaign also has its own Leads tab.
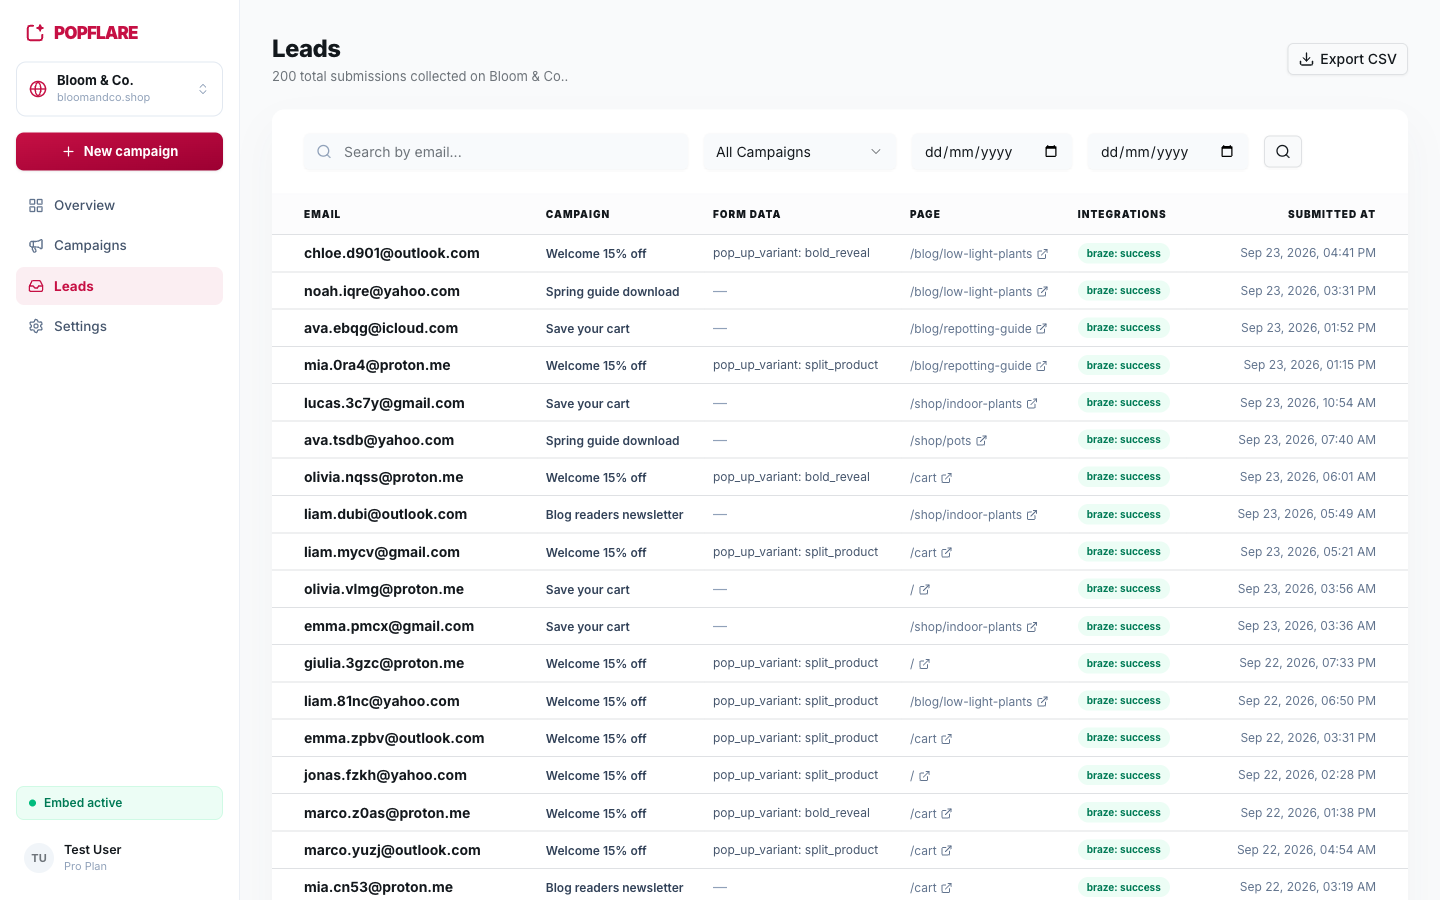
- Search by email, filter by campaign and date range.
- The Integrations column shows, per connector, whether the lead was delivered (success), is being retried or failed, and why.
- Export CSV downloads the leads matching the current filters.
Good to know
Click-goal campaigns show the Leads tab as soon as they collect at least one email, for example from a code-first step.
Campaign analytics
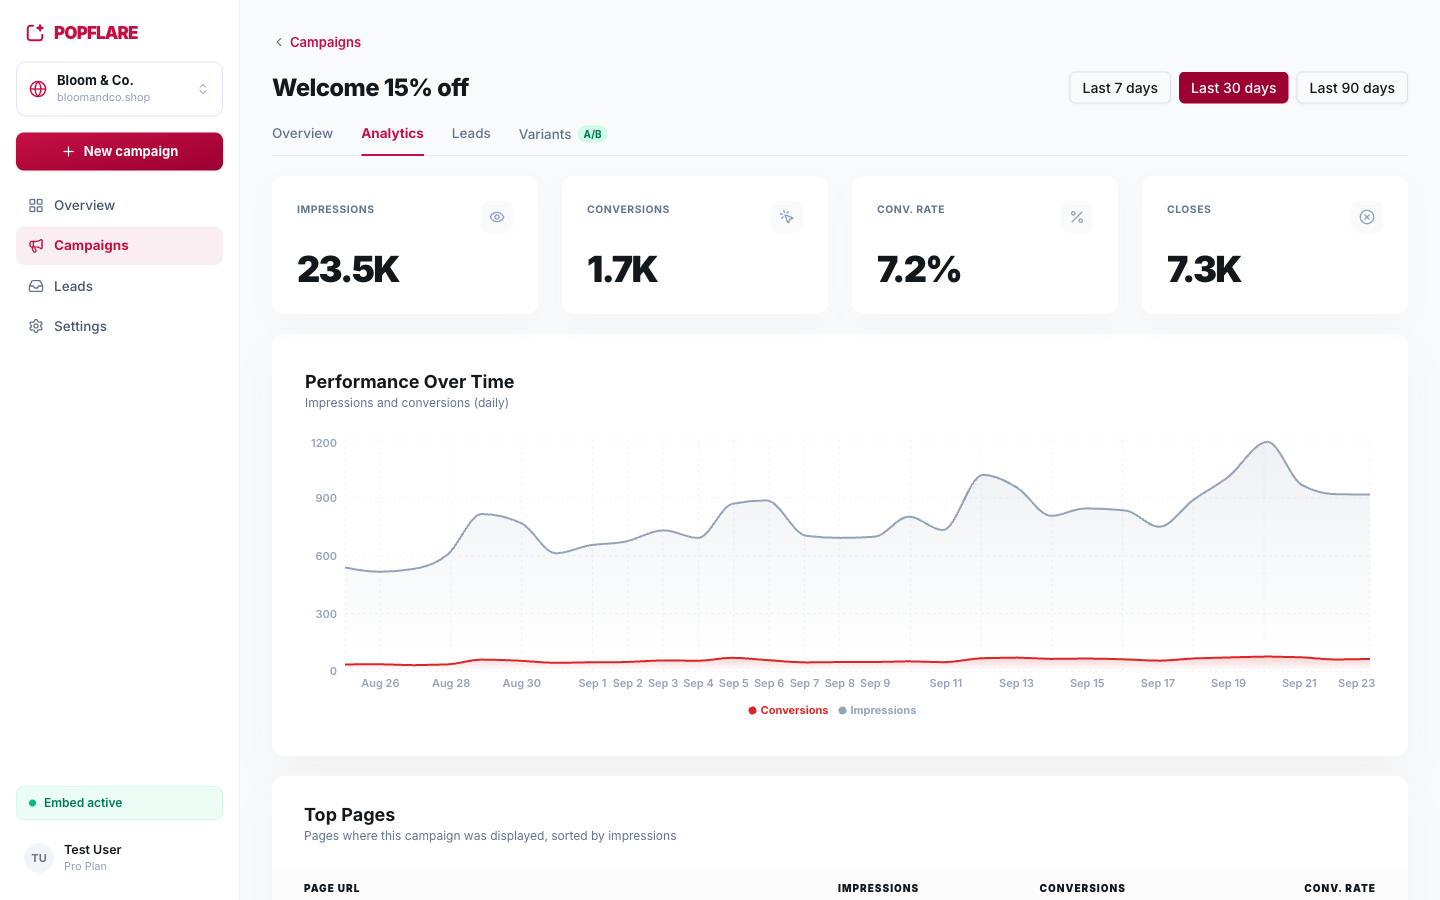
The Analytics tab of a campaign shows, for the last 7, 30 or 90 days:
- Impressions, conversions, conversion rate and closes;
- Performance over time: daily impressions and conversions;
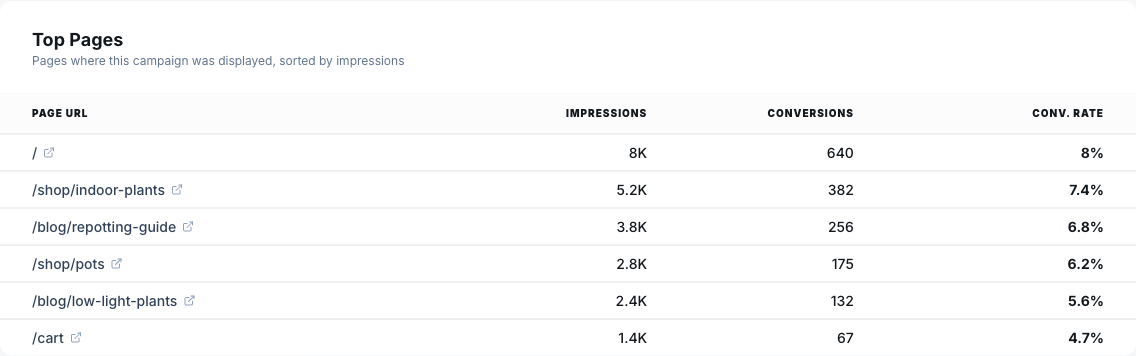
- Top pages: where the campaign was shown and where it converts best.
Site-wide numbers
The Overview dashboard aggregates all campaigns of the site and compares the selected period with the previous one. The campaign page shows the same KPIs at a glance, and the Variants tab breaks them down per variant.
Definitions
| Metric | Meaning |
|---|---|
| Impression | The campaign was displayed to a visitor. |
| Conversion | The campaign goal was reached: a form submission, or a click / step reached for click-goal campaigns. |
| Conversion rate | Conversions ÷ impressions. |
| Close | The visitor dismissed the popup (close button, "No thanks" link or backdrop). |
| Close rate | Closes ÷ impressions: a high value suggests the popup appears too early or too often. |